Syntax Layer: Prompts Are Written for Machines
Bold ** alone eats 8.5% of Tokens; YAML for complex objects, CSV for flat lists, force Minified JSON on backend output
THE QUESTION THIS PAGE ANSWERS
ANSWER FIRSTWhat is the key idea behind “Syntax Layer: Prompts Are Written for Machines”?
Bold ** alone eats 8.5% of Tokens; YAML for complex objects, CSV for flat lists, force Minified JSON on backend output
Read cost as a shape, not a single number. Break a request into input, output, retries, tools, and waiting time. The shape of usage usually tells you which design choice is expensive and where a smaller change can help.
Measure one real request before you optimize an imagined average.
A cheaper call that quietly creates more retries, latency, or review work.
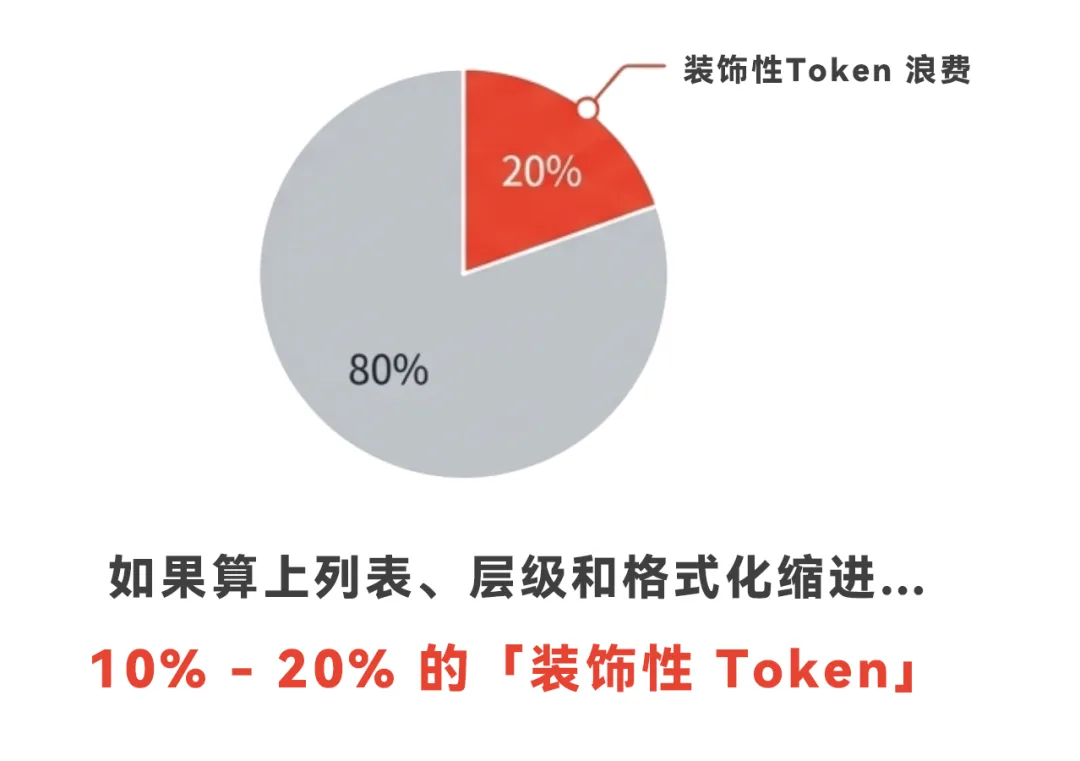
The author built a Token visualization tool (yusuan.ai/analyzer) and dropped in a slim Lyra prompt: bold ** alone ate 8.5% of Tokens. Add list markers, heading symbols, JSON indentation and newlines, and 13% of that prompt is formatting. In typical product Prompts, 10%–20% is this kind of decorative Token.

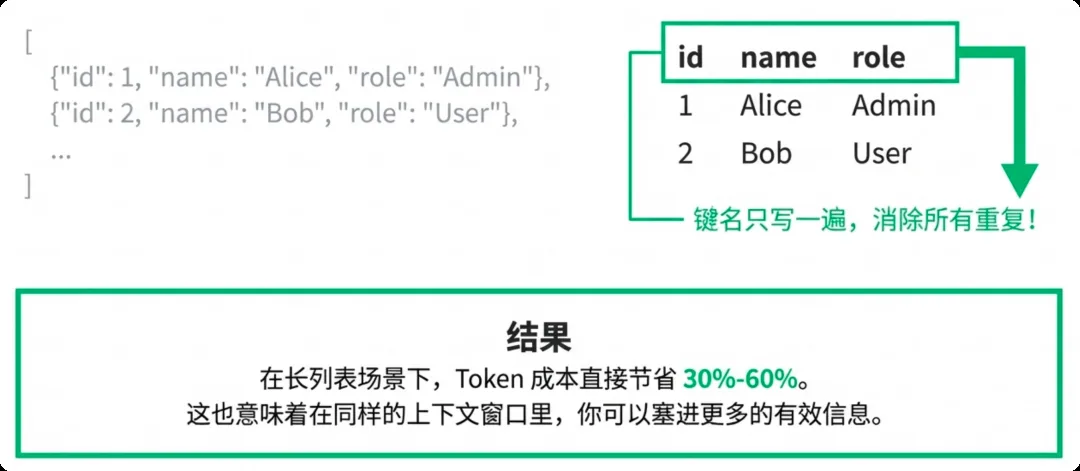
Feed the model 50 user records and compare three formats. A JSON array that repeats field names 50 times is the RAG disaster zone.
1. Complex objects: YAML (or TOON), not JSON. JSON's signal-to-noise is awful: every key wrapped in quotes, every nesting level closed with braces—and those symbols often bill as their own Tokens. YAML uses indentation instead of closers and a colon instead of “quotes+colon,” usually saving 10%–15%, sometimes up to 40%. TOON is a new format built to save Tokens, but LLMs may not support it well yet—so the steadier combo is YAML + CSV.
2. Flat lists: CSV, not JSON arrays. A headered table kills repeated key names. Long-list scenarios cut 30%–60%, and the same context window holds more data.
3. Backend output: force Minified JSON. Output Tokens cost more than input, and they slow the API return. Streaming to users can stay looser, but pure backend jobs (tag extraction, sentiment, cleaning) need zero layout—spell it out in the System Prompt:
Machines reading data need validity, not beauty. Add this constraint to batch jobs and generation time drops noticeably.
Measure your Prompt on yusuan.ai/analyzer first: decorative Tokens usually take 10%–20%—the easiest money you'll reclaim.
Pick data shape by scenario: YAML for complex objects, CSV for flat lists, Minified JSON for backend output.
Output costs more than input, so locking output format saves money and latency (lesson 12 has three more moves).
Source: Adapted from the author's internal team share “AI Token Cost Engineering Strategies,” hands-on section “01|Syntax Layer.” Tool: yusuan.ai/analyzer; YAML spec at yaml.org.
The complete interaction cost of “How heavy is this tax: 13% is formatting”
“The author built a Token visualization tool ( yusuan.ai/analyzer ) and dropped in a slim Lyra prompt: bold ** alone ate 8.5% of Tokens .” is a reminder that AI cost is not one price multiplied by one call. Input, output, retries, tools, waiting time, and human cleanup together decide what a task really costs.
Find what the bill repeats
The key variables behind “Feed the model 50 user records and compare three formats.” are usually repeated context, oversized output, retries after failure, and calls that do not produce useful progress. Removing wasted Tokens can reduce cost, latency, and concurrency pressure at the same time.
A cheaper call can make the whole workflow more expensive
Start with “Output costs more than input, so locking output format saves money and latency (lesson 12 has three more moves)” and keep a small table for input, output, retries, tools, and human review. Compare quality before and after optimizing instead of looking at one price in isolation.
From “How heavy is this tax: 13% is formatting” to “Interactive Demo · Three bills for the same data”
“How heavy is this tax: 13% is formatting” grounds the problem in “The author built a Token visualization tool ( yusuan.ai/analyzer ) and dropped in a slim Lyra prompt: bold ** alone ate 8.5% of Tokens . Add list markers, heading symbols, JSON indentation and newlines, and 13%…”. “Interactive Demo · Three bills for the same data” then moves it toward “Feed the model 50 user records and compare three formats. A JSON array that repeats field names 50 times is the RAG disaster zone”. Together, they show that the lesson is not just a conclusion to remember, but a claim with conditions.
Carry the judgment into the next situation
When analyzing cost, map the complete interaction first, then find repeated input, wasted output, and retries. A cheap individual call does not make the whole task cheap.
- “How heavy is this tax: 13% is formatting”: The author built a Token visualization tool ( yusuan.ai/analyzer ) and dropped in a slim Lyra prompt: bold ** alone ate 8.5% of Tokens . Add list markers, heading symbols, JSON indentation and newlines, and 13%…
- “Interactive Demo · Three bills for the same data”: Feed the model 50 user records and compare three formats. A JSON array that repeats field names 50 times is the RAG disaster zone
- “The closing point”: Pick data shape by scenario: YAML for complex objects, CSV for flat lists, Minified JSON for backend output
The final “The closing point” brings the discussion to “Pick data shape by scenario: YAML for complex objects, CSV for flat lists, Minified JSON for backend output”. The useful thing to carry forward is knowing which judgments must be revisited when input, scale, or risk changes.
I turned one judgment from this article into a small experiment I could run today. Knowing what to observe next is more useful than simply remembering the conclusion.
After reading this, I first looked for the conditions behind the idea instead of copying the method into a project. That order made the later trade-offs much clearer.
When this judgment reaches real work, which constraint should be added first? I am curious which step matters most between reading and the first practical attempt.
No discussion on this article yet.